

Data is the new currency in the rapidly evolving retailing world. High-tech companies no longer trust their instincts, but they trust Retail Analytics Dashboards to convert the sophisticated data into a crystal-clear view.
A 2024 Statista report shows that of all retailers in the U.S., more than three-quarters use real-time analytics to make quicker decisions and increase profit margins.
The smart dashboards integrate data on sales, customers, and inventory to direct every action, including pricing and placement of products.
This article outlines how Retail Business, Retail KPI, and Retail Sales dashboards enhance strategic agility, streamline operations, and transform success parameters in retailing in the contemporary business environment.
What Are Retail Analytics Dashboards?
A Retail Dashboard is a tool that integrates all the information regarding sales, inventory and customers into one simple system. It represents complex and obscure information through a simple and intuitive visual form. Unlike one-size-fits-all dashboards, Retail Analytics Dashboards tend to the specialized needs of the retail sector, wherein the value of data is time-sensitive and contextual.
These dashboards offer actionable insights, thereby eliminating uninformed speculation around sales trends. Retailers have immediate access to and can quickly identify sales and inventory trends. This is the reason leading retailers are able to adjust prices, modify the size of working shifts, and change marketing strategies based on in-the-moment data, rather than on instinct.
Types of retail analytics dashboards
One retail dashboard is fine, but what about one more? Diverse dashboards may be task-specific so that you can have a comprehensive view of your business.
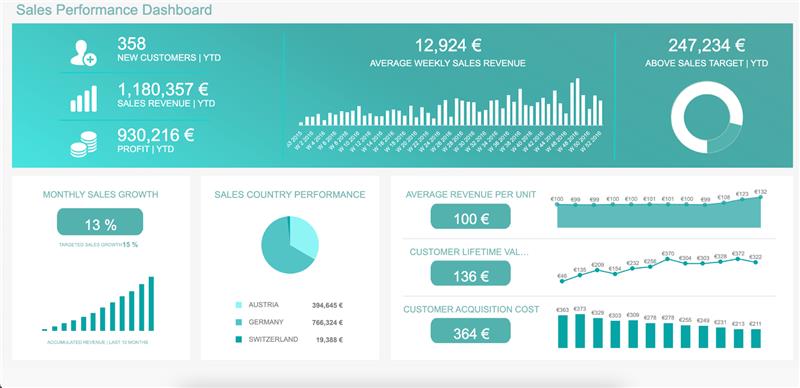
Sales performance dashboard:
-
Beyond basic sales figures: Look at sales trends by product category, location, demographics, and customer segments. This unveils which products or groups drive sales and where you can invest more.
-
Dig into sales by channel: Analyse online vs. in-store sales performance, identify high-performing channels, and optimize marketing efforts accordingly.
-
Customer lifetime value (CLTV) analysis: Incorporate CLTV metrics to understand customer profitability over time. This helps target high-value customers and personalise marketing strategies.
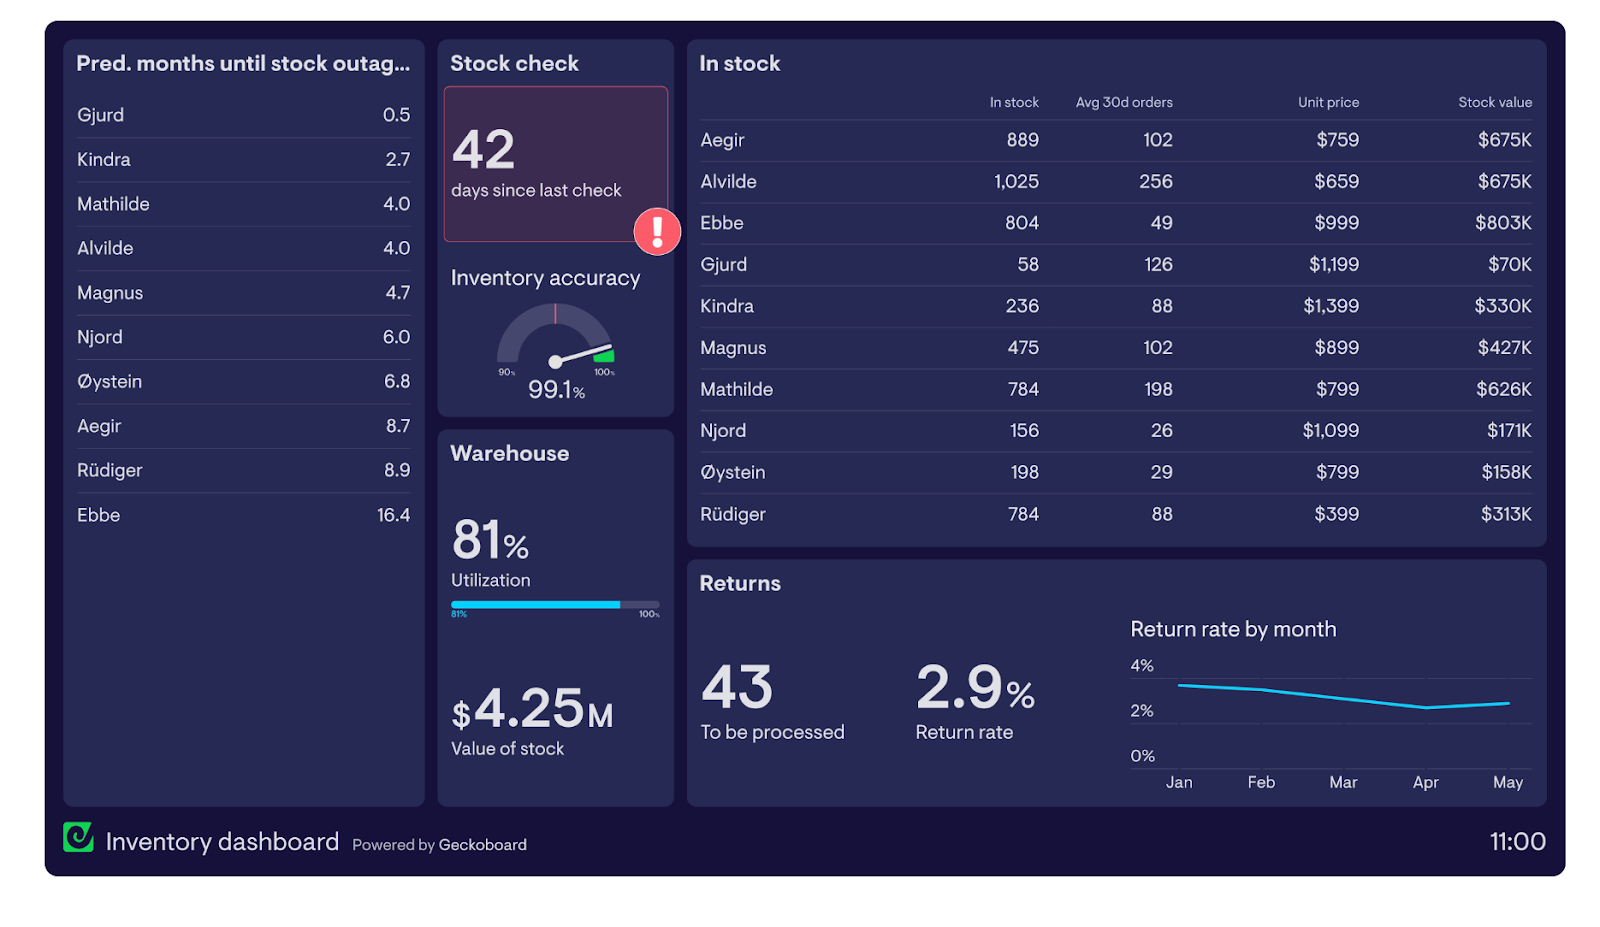
Inventory management dashboard:
-
Predict demand: Predict demand with the help of machine learning and optimize the inventory levels. This reduces the stockouts, eliminates the excess stock and improves the cash flow.
-
Inventory turnover analysis: Track the inventory turnover rates to identify the high and slow moving products. Reduce the stock levels by changing the ordering pattern.
-
ABC analysis: Categorization of inventory items into A (high value/low volume), B (medium value/medium volume) and C (low value/high volume) items. Introduce specific inventory management strategies to each of the categories.
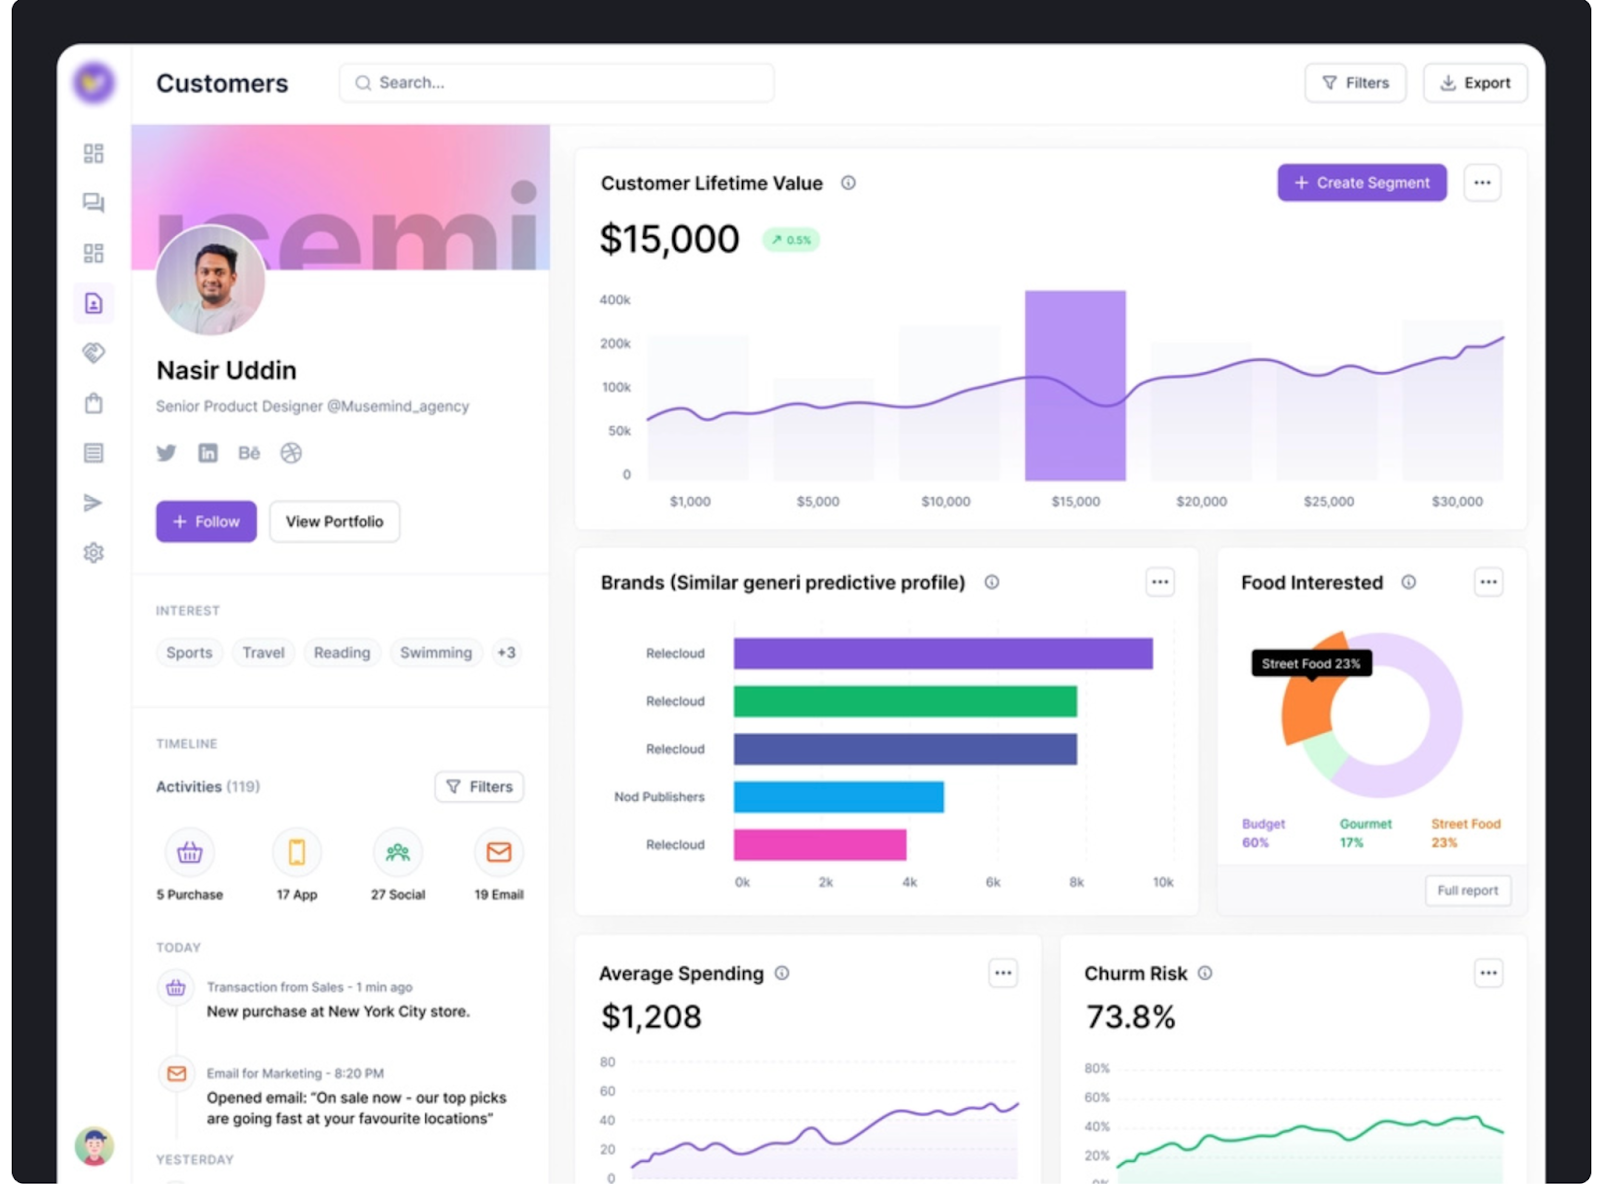
Customer analytics dashboard:
-
Customer segmentation: You can classify the customers based on their purchase behaviour, their participation in the loyalty programme, and their past interactions. This enables focused marketing and promotion.
-
RFM analysis: This is a Customer Analysis that makes the comparison of customer behaviour based on Recency, Frequency, and Monetary Value (RFM) analysis. Identify the most valuable customers and target the marketing activities to the different groups of customers.
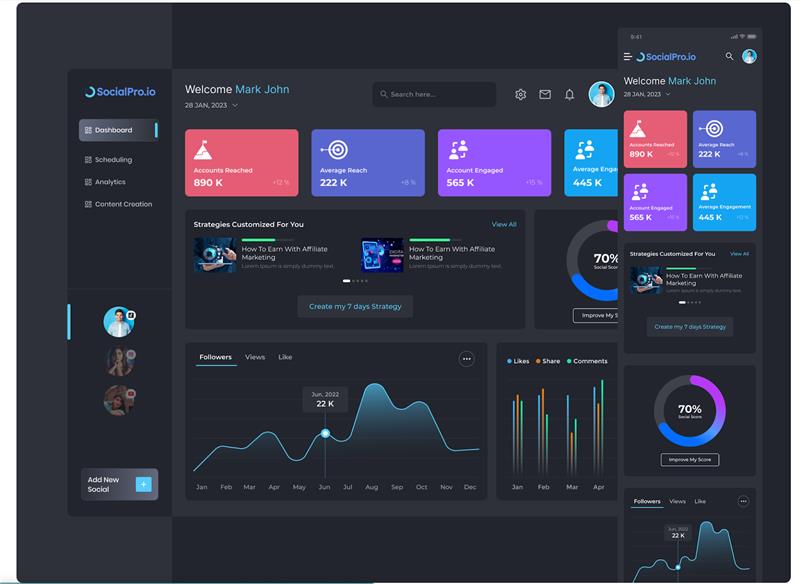
Marketing performance dashboard:
-
Customer acquisition cost (CAC) analysis: Track CAC measurements to determine the cost of customer acquisition. Maximise marketing programs to attract customers at a profitable rate.
-
Marketing ROI analysis: Determine your marketing campaign returns (ROI). Determine the successful campaigns and allocate the budgets to achieve improved outcomes.
Why Every Retailer Needs a Retail Dashboard
Without a Retail Dashboard, retailers often fly blind. Sales drop, shelves go empty, and trends go unnoticed until it’s too late. Dashboards eliminate that blind spot. They show what’s happening across stores so that decisions are informed as opposed to impulsive.
An intelligent dashboard covers almost every aspect of strategic support as well as everyday operational support. For instance, managers are able to check daily data for each store to assess performance, while executives use data to formulate plans for each store for the upcoming season.
Key Components of a Retail Business Dashboard
A Retail Business Dashboard puts together a lot of data in one easy-to-read interface. It connects to sales systems, POS software, supply chains, and marketing platforms. Each part has a job to do:
-
Sources of Data: POS, CRM, ERP, and orders placed online
-
Key performance indicators (KPIs) include sales revenue, profit margin, and foot traffic.
-
Visuals: Charts, maps, and trend lines that show what you need to know
Real-time feeds make sure that decisions are always in line with the market's rhythm and are never late or out of date.
Essential Metrics for a Retail KPI Dashboard
The heart of every Retail KPI Dashboard lies in the metrics it tracks. You can’t improve what you can’t measure.
Key KPIs include:
|
Metric |
Purpose |
|
Sales Volume |
Understand store performance |
|
Profit Margin |
Measure profitability |
|
Inventory Turnover |
Manage stock efficiency |
|
Conversion Rate |
Track shopper engagement |
|
Average Basket Size |
Reveal buying habits |
These statistics indicate the story of growth or decline—assisting managers make proactive decisions before problems arise.
Types of Retail Dashboards: Sales, Inventory & Customer Insights
There are more than one type of Retail Dashboard. Each of its types focuses on a different part of the business.
-
Retail Sales Dashboard: Monitors daily sales, revenue, and trends.
-
Inventory Dashboard: Tracks product flow, shortages, and overstocks.
-
Customer Insights Dashboard: Studies demographics, satisfaction, and repeat visits.
-
Store Performance Dashboard: Compares different branches or departments.
Together, these dashboards create a complete 360-degree view of the retail operation.
How to Design an Effective Retail Dashboard
Design can make or break your dashboard. The ideal Retail Analytics Dashboards are lean, usable and adaptable. Use color wisely, avoid clutter, and make sure every chart has a clear purpose. Group KPIs logically—sales, customer, and inventory.
Good dashboards enable users to drill-in to get more details. Filters allow you to target a single store, single product or single period. It is not about having fewer images; simplicity involves demonstrating what is most important at first sight.
Using Power BI for Retail Analytics Dashboard Implementation
The Retail Dashboard templates offered by Power BI are revolutionary. Microsoft Power BI and Vidi Corp, for example, provide built-in samples for retail and seamlessly connect to POS and ERP systems. (Microsoft Learn)
The Dashboard of Retail Store in Power BI, for example, is used to show real-time visualization of sales, cost, and profit statistics by area or category.
How Retail Analytics Dashboards Empower Smarter Decisions
The main ways through which these dashboards enable better business strategies and implementation are as described below.
1. Data-Driven Decision Culture
Dashboards minimize the use of the gut feeling or anecdotal decisions as they offer a “single source of truth. The leaders can make decisions based on the metrics such as the trend in the margin, customer retention rate or campaign ROI. This also increases the culture of analysis in the organization over time.
2. Faster Reaction to Trends and Issues
Dashboards can be used to instantly notify when the metrics overshot the limits (e.g., the sales decreased by 10% or the inventory decreased to an unsafe level). It implies that the management can act within a short period of time, whether it is to adjust the pricing, restock the shelves, start flash offers, or check the performance of the store.
3. Improved Inventory Optimization
The inventory dashboards enable the teams to harmonise the stock levels with demand forecasts to reduce overstock and limit stockouts. Inventory management helps enhance cash flow and customer satisfaction.
4. Channel & Promotional Optimization
With a sales performance perspective between online and store (sales) and integrating the same with the marketing campaign performance, dashboards can be used to calculate marketing ROI, assign revenue, and redeploy budgets on the most successful promotions.
5. Store Benchmarking & Best Practices
Multi-store retail dashboard gives the opportunity to make comparisons: which stores perform better, which require action and what could be applied to all stores within the chain. Benchmarking identifies operational inefficiencies, staffing gaps or product mix opportunities.
6. Customer & Segmentation Insights
RFM (recently, frequently, monetically) analysis, lifetime value (CLTV) measures, and segmentation are all made possible through dashboards that incorporate customer data. Retailers are able to focus on high value crafts and do retention campaigns.
7. Forecasting & Scenario Planning
In case dashboards have forecasting models (e.g. based on time-series or machine learning), managers are able to simulate what-if scenarios (e.g. price change, promotion impact). This empowers active planning as opposed to responsive strategies.
8. Cross-Functional Alignment & Collaboration
Dashboards eliminate silos: marketing, operations, finance, and store teams have overlapping data and can work more effectively together. According to Datacalculus, the incorporation of reporting tools and common dashboards will lead to more easily interpreted and determined decisions by the team.
Challenges & Pitfalls to Watch Out For
Even though dashboards are effective, they are associated with limitations:
-
Data Silos & Integration Problems: Mismatched or disconnected systems may result in different metrics.
-
Too many Dashboards: Attempting to display everything emphasizes nothing.
-
Vanity Metrics vs. Actionable KPI: Do not use metrics that look good but do not make a decision.
-
Lagging and Leading Indicators: Dashboards need to strike a balance between past and future.
-
Governance and Data Accuracy: Bad or outdated data destroys credibility.
-
Resistance to Change: users might not be willing to shift from transition reports to dashboards, and it will have to be supported through trainings.
Future Trends: AI, Predictive Analytics & Next-Gen Retail Dashboards
Retail Analytics for Tomorrow Dashboards will not only describe things, but also predict them. Dashboards powered by AI already predict peaks in demand, make automatic inventory orders, and recommend price alterations.
Prescriptive analytics which recommend the next best action, such as when to restock and what items to promote, are gaining traction. Machine learning is transforming dashboards from static reports into digital advisors.
Conclusion & Roadmap to Adoption
The analytics is the first step towards a smarter retail. Begin by identifying your goals, then select the right Retail Dashboard tool—be it Power BI, Tableau, or Looker.
Don’t treat it as a tech upgrade; treat it as a mindset shift. With Retail Analytics Dashboards, businesses move from reaction to prediction and from confusion to clarity. The results of this are sharper decisions, happier customers, and unstoppable growth.
Key Takeaway Table
|
Dashboard Type |
Focus Area |
Key Benefit |
|
Retail Sales Dashboard |
Sales Performance |
Track real-time revenue and profit |
|
Retail KPI Dashboard |
Key Metrics |
Monitor health of retail business |
|
Retail Business Dashboard |
Overall View |
Combine sales, customer, and inventory insights |
|
Power BI Retail Dashboard |
Data Visualization |
Automate insights and forecasting |
It is a visual graph, which demonstrates real time retail data to businesses to monitor performances and make intelligent decisions.
It shows KPIs (key performance indicators), which helps you see patterns, boost effectiveness, and improve sales strategies.
A Retail Analytics Dashboard should include sales revenue, profit margin, inventory turnover, conversion rate, and average basket size. These KPIs help track performance, efficiency, and customer behavior in real time.
They align inventory levels with demand forecasts by highlighting slow-moving, fast-selling, and at-risk products. This reduces stockouts, prevents overstocking, and improves cash flow.
Yes. Modern tools like Power BI and cloud BI platforms make dashboards affordable and scalable. Even small retailers can gain real-time insights without heavy IT investment.


