Marg Indicative
Marg ERP 9+
 4.4
4.4
Pricing of Marg ERP-Pharmaceutical Industry Software
Pricing plans
Introduce pricing plans
Simple, transparent pricing that grows with you. Try any plan free for 30 days.
- 50M events/month
- Segmentation with calculations and KPIs
- Custom Calculations
- Multipath Funnel : Limited
- Funnel Conversion Over Time : Limited
- Cohorts and Retention
- User Activity Timeline
- Behavioral User Segments : Limited
- Saved Views : Limited
- Team Folders
- Customizable Dashboard Refresh : Limited
- Data Volume (monthly) : 50
- 000
- 000
- Data History : 6 months
- Projects : 1 testing
- 1 production
- Self-serve Data Sources
- User Aliasing
- Customizable Data Dictionary
- Live Event Debugger
- Custom Events : Up to
Pro
USD 950.00 //Month
USD0.00
Perfect for your business requirements and platform usage.
BOOK A DEMO- 250M events/month
- Includes features of Free plan
- plus
- Multipath Funnel
- Funnel Conversion Over Time
- Behavioral User Segments
- User Segments API
- Saved Views
- Customizable Dashboard Refresh
- Scheduled Reports
- Shareable dashboards
- Printable Dashboards
- Data Volume (monthly) : 250
- 000
- 000
- Data History : 12 months
- Projects : 1 testing
- 2 production
- Custom Data Sources
- Data Destinations
- Custom Events
- Joined Events
- CSV Exports : Up to 1
- 000 rows
- Unlimited user seats
- Support Response Time : 2 business days
Enterprise
USD 0.00 /
USD0.00
Perfect for your business requirements and platform usage.
BOOK A DEMO- Custom event volume
- Includes features of Professional plan
- plus
- Common Paths (coming soon)
- Data Volume (monthly) : Custom
- Data History : Custom
- Projects : 1 testing
- 4 production
- Additional Projects : $200 per month per additional project
- Project-level Filters
- CSV Exports
- Custom Agreement
- Custom SLA
- SAML-based SSO (coming soon)
- Regional Cloud Deployment : Add-on
- White Labeling : Add-on
- Support Response Time : 1 business day
- End-to-end Onboarding Support : Weekly status updates through integrati
Key Specification
| Other Categories: | |
|---|---|
| Deployment: | Cloud Hosted |
| Customer Support: | Business Hours,Online (Ticket) |
| Customization: | No |
| Languages Support: | English |
Who uses Indicative


Company Details
- Company Name: Indicative
- Headquarter: New York,
Indicative Description
Key Features & Specifications
- Alert Notifications
- Multiple Site Management
- Report Generation
- Time on site Tracking
- User Interaction Tracking
- Goal Tracking
- Conversion Tracking
- Campaign Management
- Event Tracking
- Heatmaps
- Push Notifications
- Funnel Analysis
- Revenue Tracking
- Retention Tracking
- Cohort Analysis
- A/B Testing
Indicative Video
Alternative
More Alternative
Keka HR Payroll Platform Screenshots
User Reviews
WRITE A REVIEW
What do you like best?
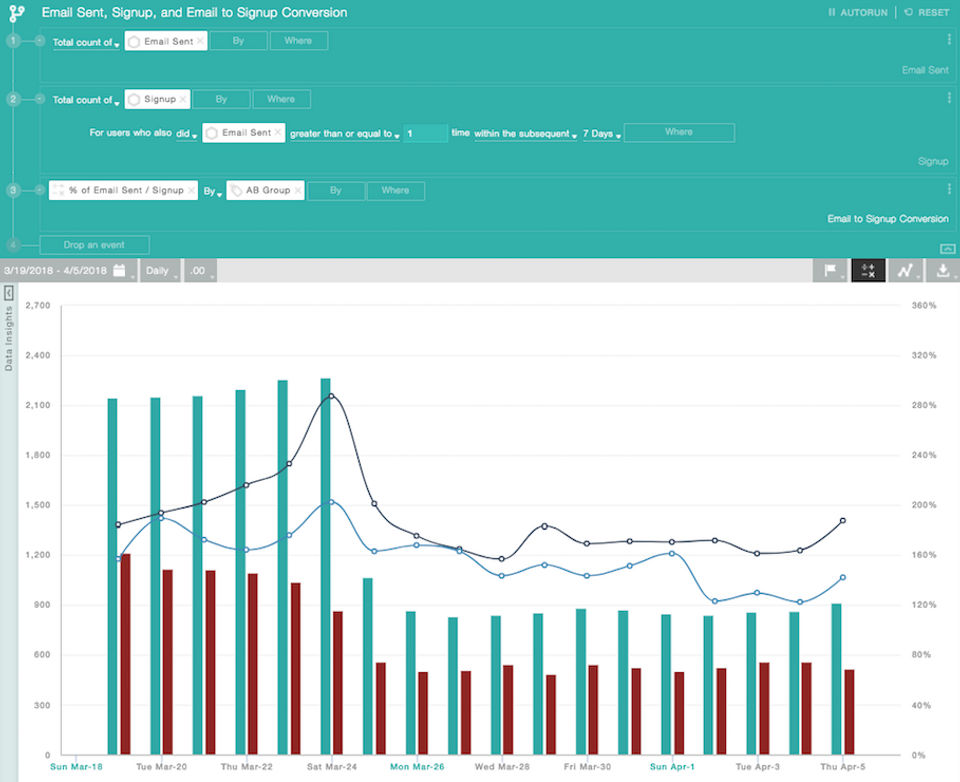
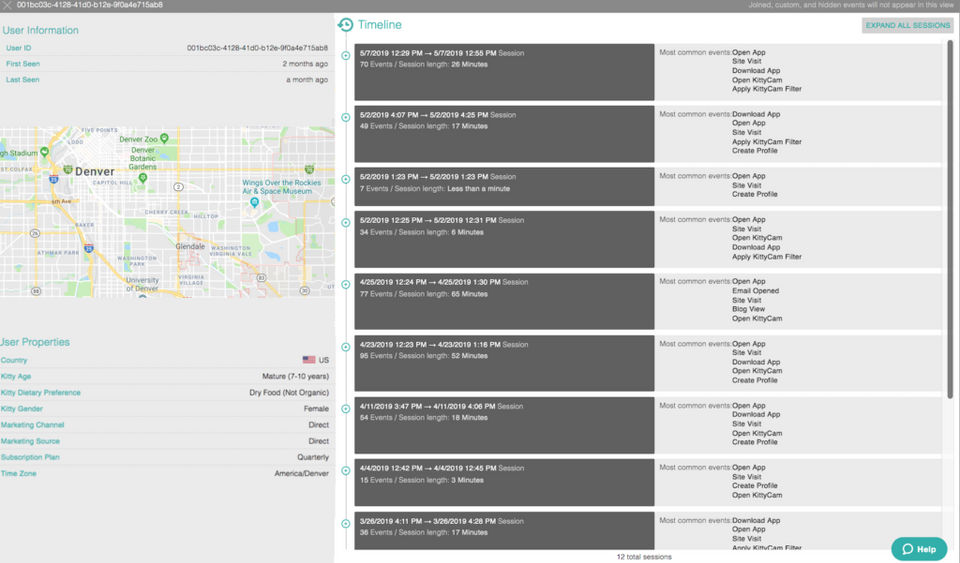
Indicative has four analysis tools that have a nice drag-and-drop functionality, a quick load time, and good filters with a dropdown menu. The filters and group by's are useful and intuitive to use. The properties explorer is neat and very detailed. Having all the user properties and events on tabs is useful to be able to see what we have. Seeing the annotations is helpful as well. Overall, I like that Indicative has everything in one place.
What do you dislike?
Their dashboards aren't easy to make and each panel is not very customizable, so that means the dashboard doesn't quite fit the job. The events that are listed on the right side are not able to be organized. We have a lot of events, but they are just listed in alphabetical order, containing customer events and in-app user events. The graphic can use more customizability as well, so that we can see exactly what we want. I would also like to be able to do certain calculations for custom views. For example, Indicative allows us to see the total count of event and the total number of users, but would not we able to give direct insight into the total count per user. They only have a limited amount of types of visualizations. The ability to have labels for values appear without hovering over the data point would also be appreciated.
Although Indicative has things sorted in buckets and all things in those places, it lacks infrastructure to organize large amounts of types of data and events.
Recommendations to others considering the product:
I would contact them to see if they are the right fit for you, but for our company, it doesn't seem like the best fit.
What problems are you solving with the product? What benefits have you realized?
Segmenting users based on specific traits and seeing the funnel of customers/users. We don't use it all too often, because we want to be able to have the ability to make more custom views and drill into the data more efficiently.The benefits are that Indicative does give quick answers, but often they can only answer simple questions.
What do you like best?
How simple the process is to see data and how the data can be visualistes
What do you dislike?
Sometimes the data is not accurate or the site is not working
What problems are you solving with the product? What benefits have you realized?
Finding out where data events are not working properly, identifying where users stop in a process
What do you like best?
Mobile attribution, visual way of using queries, ease of use, chart options, segmentation options
What do you dislike?
Lack of insight into web attribution (GA isn't hooked up -- but not sure if this is unique to our account / is a possible functionality.
Recommendations to others considering the product:
Get a tutorial upfront -- it's pretty user friendly, but there are little nuances
What problems are you solving with the product? What benefits have you realized?
Mobile attribution -- we've been able to budget more effectively across channels because of this.
Keka HR Payroll Platform Key Clients
Frequently asked questions
Everything you need to know about discovering, comparing, and choosing the right AI software for your business.
Indicative has 3 plans,
- Standard USD 0.00
- Pro USD 950.00 /Month
- Enterprise USD 0.00
Indicative is the AI Web Analytics Software used for the below functionalities.
Top 5 Indicative features
- Alert Notifications
- Multiple Site Management
- Report Generation
- Time on site Tracking
- User Interaction Tracking
Indicative provides Business Hours,Online (Ticket) support.
Indicative is allowed 0 Days Free Trial.
Indicative provides Help Guides,Blogs,Video Guides for the software training.
Need Help Selecting
the Right AI Solution?
Speak with our team for tailored recommendations and insights to accelerate your AI adoption.